Simplifying eCommerce reporting across international sites with multiple currencies

It’s quite common for organizations to have complex reporting requirements that combine multiple data sources. In these cases, an efficient way to get at Google Analytics data is to use the API. But for those without the development resources needed to access the API there are many Google Analytics Apps available that can offer a solution. The following mini case study is about Analytics Canvas, a 3rd party Google Analytics App. Analytics Canvas helped Fairmont Raffles Hotels International take a complex reporting task and make it easy.

Like most global organizations, Fairmont Raffles Hotels International has regionally operated business units. Each unit typically maintains its own reporting profile in Google Analytics. But with individual business unit profiles, how do you analyze the data across all the business units? And, how do you combine external business data with each of these Google Analytics profiles?

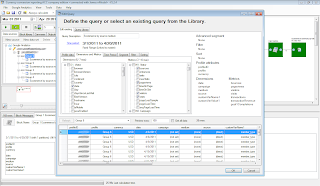
For Fairmont Raffles Hotels International, the answers lie in the Analytics Canvas tool from nModal. Analytics Canvas is an easy to use, drag-n-drop interface for creating data queries and transformations needed for advanced reports and dashboards. Analytics Canvas can extract data from multiple Google Analytics accounts, combine it with additional data sources, and then segment and filter the data.


Barbara Pezzi, Director Analytics & Search Optimization, Fairmont Raffles Hotels International, uses Analytics Canvas to automate her complex reporting tasks. “We trade in over 10 different currencies on our websites. We needed to have multiple international hotels’ eCommerce data converted to a common currency in various reports, such as ‘All Traffic Sources’ and ‘Campaigns’, to analyze the overall production of each traffic channel and marketing initiative. Traditionally we would have to export data from multiple profiles and do currency conversion by hand in spreadsheets. With almost 100 hotels, the large number of profiles made it a very time consuming and potentially error prone task to get a multi-hotel, single currency report.” With Analytics Canvas, Fairmont automated this task in minutes with a single currency report for all its hotels.


Analytics Canvas was built by nModal Solutions Inc using the Google Analytics API. Here is what James Standen, the founder of nModal, has to say “The Google Analytics API is very easy to use and the full access to data makes it possible to make a very powerful query interface. So far we’ve had a great response to Analytics Canvas. People are very pleased to have greater access to their web traffic data, and we’re thrilled to hear about the interesting new applications and integrations our customers are able to do using our tool.”

The Analytics Canvas application can be found through the Google Analytics App Gallery and can be downloaded from the Analytics Canvas website.

If you’re interested in developing applications for the Google Analytics platform visit Google Analytics for Developers.

BCIT increases visitor satisfaction with 4Q Suite and the Google Analytics API

One of the great aspects of being part of the Developer Relations team for Google Analytics is that I get to work with a lot of awesome partners that build cool and successful apps using the Google Analytics API. We've decided to share these successes as a series of mini case studies highlighting a variety of Google Analytics Apps. And to start off with we have iPerceptions’ 4Q Suite.

Objective: Improve the visitor experience
British Columbia Institute of Technology wanted their website to be both functional and satisfying. But, behavioral data alone wasn’t telling them what key audiences thought about the site. BCIT knew what visitors were doing on the site but wanted to learn more about why they behave the way they do. The overall objective for BCIT was to gain a better understanding of which content and processes were most effective for various audiences.

The Solution: 4Q Suite and the Google Analytics API
To meet this objective, BCIT chose 4Q Suite, an online survey tool built by iPerceptions. 4Q uses the Google Analytics API to link 4Q Suite survey responses with the corresponding Google Analytics session data. An analyst can then use this data to answer questions related to visitor intention and satisfaction. 4Q tracks six “Voice of Customer” events within Google Analytics. These events are related to survey completion, task completion, purpose of visit, and overall satisfaction. With 4Q survey data available in Google Analytics, marketers can better prioritize site enhancements, monitor the effectiveness of ad campaigns and marketing events more closely, and quickly identify changes in conversion. The Google Analytics API also makes it possible for 4Q to export GA data into the 4Q Suite dashboard, enabling analysis of the integrated dataset and open-ended feedback. And, users can view or receive automated alerts of significant changes based on the combination of 4Q Suite and Google Analytics data.


Result: Increased visitor satisfaction
Alan Etkin, Project and Web Analytics Manager at British Columbia Institute of Technology uses Google Analytics and 4Q Suite to segment site visitors by key audiences (students, prospective students, and faculty & staff), and see the differences in task completion and satisfaction. When BCIT redesigned their site with a strategic focus on prospective students, they saw a 15% increase in satisfaction among these visitors. Their behavioral analytics data also showed a 279% increase in a key conversion event for prospective students. From a strategic standpoint, 4Q Suite has given BCIT a clearer understanding of key audiences and has helped them report their results to the leadership team with easy to understand metrics. This, in turn, has helped them secure additional resources and the support to move forward with new projects.

About 4Q Suite and Google Analytics
4Q Suite was built by iPerceptions. According to Claude Guay, President & CEO, “The response has been tremendously positive. Many of our clients insist that the integration between 4Q Suite and Google Analytics is the most valuable feature that iPerceptions has to offer because it connects what visitors are doing on their website with why they are doing it and how satisfied they are. 4Q Suite has rounded out our Voice of Customer analytics offering. Now companies of all sizes can hear what their website visitors are saying, connect the what with the why, and react to the issues that affect satisfaction and conversion. In the space of a few weeks since launching, hundreds of 4Q Suite customers have already enabled Google Analytics integration.”

4Q Suite can be found through the Google Analytics App Gallery or directly from the 4Q Suite website.

If you’re interested in developing applications for the Google Analytics platform visit Google Analytics for Developers.

Introducing two new versions of the Management API


Today we are releasing two new versions of our Management API into public beta; a brand new version 3.0 and a backwards compatible version 2.4. While the data the API exposes is the same, both versions migrate the Management API from the existing Google Data Protocol to Google’s new API infrastructure. This impacts the way you request and handle data from the API.

With this change, we are also announcing the deprecation of the legacy version 2.3 of the Management API. It will continue to work for 2 months, after which all v2.3 requests will return a v2.4 response.

The biggest changes in switching to the new versions are that developers need to register their applications via the Google APIs Console and use a developer token. Also the URL endpoints have changed, which influence how you request OAuth authorization tokens.

Here’s a rundown of what’s new:

Version 3.0
Is the latest major version of our API and is not backwards compatible. Features include:

  • A faster response over version 2.3

  • An improved quota policy

  • Integration with the Google APIs console to manage API access and request more quota

  • OAuth 2.0 is now the recommended way to Authorize users

  • The URL to make requests is now at https://www.googleapis.com/analytics/v3/management/...

  • The API response is more compact using JSON

  • New Google API client libraries, which support many more languages

  • Support for the Google Discovery API


All future development of the API will be done to this version so we also added some exciting new data only in version 3, including:

  • Event goals are fully represented

  • An internal web property id which can be used to deep link into the GA user interface

  • Profile configurations for the default page and site search query parameters


Version 2.4
This is a minor version upgrade and we tried hard to make it backwards compatible with the existing Version 2.3. New changes include:

  • A faster response over version 2.3

  • An improved quota policy

  • Integration with the Google API console to manage API access and request more quota

  • Continued support for existing authorization mechanisms; OAuth 2.0 now supported

  • The URL to make requests is now at https://www.googleapis.com/analytics/v2.4/management/...

  • Supports XML response only

  • The Google Data JavaScript client library will not work with this version


The XML output from this version is the same as version 2.3 so the existing Google Data client libraries will continue to work.

If You’re a Developer, What You Need To Do
Take a deep breath and get excited ;)

While we typically don’t share our roadmap, to alleviate any concerns, we wanted to give you some insight on where we’re going and how this release fits into the bigger picture. Today’s release adds two new versions to the Management API, v2.4 and v3.0. We also have a Data Export API that provides access to report data, which is still on version 2.3. In the future, we plan to do a similar upgrade to the Data Export API Data Feed by releasing two new versions for it, and deprecating version 2.3. At that time, we also plan to completely deprecate the Data Export API Account Feed.

The future of our APIs is to access all configuration data through the Management API and all processed report data through the Data Export API.

So for now, if you are already using the Management API, we recommend you migrate to the latest and greatest version 3.0.

If you are still using the Account Feed in the Data Export API, we highly recommend you test out the new Management API and start planning your migration. But, you can probably wait to do a full migration until all our APIs are on version 3.0.

If you have any questions feel free to reach out in our Management API developer group.


New Ecommerce Tracking and Validation in the Analytics SDK for iOS

Back in May, we announced Version 1.2 of the Google Analytics SDK for Android.

Today we’re happy to announce that Google Analytics SDK for iOS version 1.2 has been released.  This new version supports Ecommerce tracking as well as the new debug and dry run modes, just like its Android counterpart.

Ecommerce Tracking
With Ecommerce mobile tracking, you can capture transaction and product information, send the data to Google Analytics, and then analyze which products performed best. Of course, because this is all within Google Analytics, you can also tie transaction data back to app usage behavior. See the Google Analytics SDK for iOS developer docs to learn how to implement this feature.

Debug and Validation
In addition to Ecommerce, we’ve added new debug and dry run modes to make it easier to validate your Google Analytics implementation.

Debug Mode:

[[GANTracker sharedTracker] setDebug:YES];

With debug mode, all data requests to Google Analytics are sent to the debug console.

Dry Run:

[[GANTracker sharedTracker] setDryRun:YES];

The dry run mode sends all tracking data locally so that you don’t corrupt your production data.  Just be sure to turn it off before releasing your app, otherwise you won’t collect any usage data.


New Ecommerce tracking and validation in the Analytics SDK for Android

Increasingly, mobile applications allow you to purchase products and virtual goods. For that reason, it’s important to track these mobile transactions in order to understand which products perform well.

So today we’ve added Ecommerce tracking functionality to the Google Analytics SDK for Android.

Ecommerce Tracking
With Ecommerce mobile tracking, you can capture transaction and product information, send the data to Google Analytics, and then analyze which products performed best. Of course, because this is all within Google Analytics, you can also tie transaction data back to app usage behavior. For example, you can now compare the referral that generated an app download by the revenue it generated. See the Google Analytics SDK for Android developer docs to learn how to implement this feature.

Debug and Validation
In addition to Ecommerce, we’ve added new debug and dry run modes to make it easier to validate your Google Analytics implementation.

Debug Mode:

tracker.setDebug(true);

With debug mode, all data requests to Google Analytics are sent to the Android log, allowing you to validate that your app is sending data properly. You can view the Android log using the adb logcat command.

Dry Run:

tracker.setDryRun(true);

The dry run mode sends all tracking data locally so that you don’t corrupt your production data.

See Us At Google IO
We’ll be demoing all this new functionality this year Google IO, so stop by the Optimizing Android Apps With Google Analytics session on May 11, 12:30PM – 01:30PM / Room 9.

Posted by Jim Cotugno, Google Analytics Tracking Team

Client Side Authorization in the API


  if self.auth_token:
    return self.auth_token


  self.auth_token =
    self.auth_routine_util.LoadAuthToken(self.token_obj_name)


  if not self.auth_token:
    self.auth_token = self.RequestAuthToken()


  self.auth_routine_util.SaveAuthToken(self.auth_token)
  return self.auth_token


  url = ('%s?xoauth_displayname=%s' %
      (gdata.gauth.REQUEST_TOKEN_URL, self.my_client.source))


  request_token = self.my_client.GetOAuthToken(

      next='oob',
      consumer_key='anonymous',
      consumer_secret='anonymous',
      url=url)


  verify_url = request_token.generate_authorization_url(
      google_apps_domain='default')


  print 'Please log in and/or grant access at: %s\n' % verify_url
  webbrowser.open(str(verify_url))


  request_token.verifier =
'Please enter the verification code '
                'on the success page: ')


  try:
    return self.my_client.GetAccessToken(request_token)


  except gdata.client.RequestError, err:
    raise AuthError(msg='Error upgrading token: %s' % err)


  my_client.auth_token = my_auth.GetAuthToken()


except auth.AuthError, error:
  print error.msg
  sys.exit(1)


  feed = my_client.GetDataFeed(data_query)


except gdata.client.Unauthorized, error:
  print '%s\nDeleting token file.' % error
  my_auth.DeleteTokenFile()
  sys.exit(1)


Deep Dive Articles For The Data Export API

On the Google Analytics API Team, we’re fascinated with what people create using the Data Export API. You guys come up with some really amazing stuff! Lately, we’ve also been paying a lot of attention to how people use it. We looked at whether the API has stumbling points (and where they are), what common features every developer wants in their GA applications, and what tricky areas need deeper explanations than we can give by replying to posts in our discussion group.

As a result of identifying these areas, we’ve written a few in-depth articles. Each article is meant as a “Deep Dive” into a specific topic, and is paired with open-source, sample reference code.

In no particular order, the articles are as follows:

Visualizing Google Analytics Data with Google Chart Tools
This article describes how you can use JavaScript to pull data from the Export API to dynamically create and embed chart images in a web page. To do this, it shows you how to use the Data Export API and Google Chart Tools to create visualizations of your Google Analytics Data.

Outputting Data from the Data Export API to CSV Format
If you use Google Analytics, chances are that your data eventually makes its way into a spreadsheet. This article shows you how to automate all the manual work by printing data from the Data Export API in CSV, the most ubiquitous file format for table data.

Filling in Missing Values In Date Requests
If you want to request data displayed over a time series, you will find that there might be missing dates in your series requests. When requesting multiple dimensions, the Data Export API only returns entries for dates that have collected data. This can lead to missing dates in a time series, but this article describes how to fill in these missing dates.


We think this article format makes for a perfect jumping off point. Download the code, follow along in the article, and when you’re done absorbing the material, treat the code as a starting point and hack away to see what you can come up with!

And if you’ve got some more ideas for areas you’d like us to expound upon, let us know!

New Tools to Debug Your Tracking Code

Raise your hand if any of this sounds familiar to you:
  • You just set up your tracking code and you're wondering if it's correct--and you want to know right now.
  • You have decided to migrate your tracking to the new asynchronous syntax--but you want to know if your syntax has any errors.
  • You finally decided to customize the tracking code for cross-domain tracking--but you're worried that you might break your tracking.
  • You want to make sure that your campaign is set up to the correct goal.
Enter: The Google Analytics Tracking Code Debugger and a new debug version of our JavaScript code.

The Google Analytics team has launched a debugging version of the Analytics Tracking code called ga_debug.js to verify your tracking code setup. To make it even simpler, we also created a Chrome extension which uses the ga_debug.js script, which allows you to use the new ga_debug.js without re-tagagging any of your content. You can also use this extension to verify what information is sent to Analytics with each page.

How does it work? First, the ga_debug.js script provides a testing version of the tracking code which will print common syntax errors and tracking analysis messages to the browser’s JavaScript console. Secondly, the Chrome extension which automatically enables your page to use the debug version of the JavaScript without any need for you to retag or recode your pages.

How do you use it? The most simple thing to do is to download the Tracking Code Debugger extension for your Chrome browser. Next, turn on the extension by clicking on the icon to the right of the address bar on Chrome.

Finally, visit a page that contains the tracking code you want to test and open up the Chrome JavaScript console to see the messages (detailed instructions). That's it!

If you want to go use ga_debug.js without the Chrome extension, read all about how to do this in our newly revised Troubleshooting Guide on Google Code. You can use the script on your testing environment to verify extensive tracking code changes. Make sure, however, that you don't use this version of the tracking code on your production website--the script is meant for debugging and analysis, not speed, so you should always use this as a testing mechanism only. If you want to learn more about the kinds of errors this script can help you find, see Common Tracking Code Errors/Typos in our Troubleshooting Guide. While the ga_debug.js script doesn’t catch all possible errors yet, we think it’s off to a great start and will get even better over time.

Happy testing!

Brian Kuhn on behalf of the Analytics Team

A Better Developer Doc Experience

Now that the excitement of the new Management API launch has just passed its zenith, you might have also noticed that there were some interesting changes to the Analytics for Developer pages on Google Code.

Since Nick, Alex, and I were under the hood making docs and sample code for the Management API, it also seemed like a good time to spiff up the site and add some structure to handle this burgeoning developer resource.

New Look and Feel
Nick went to town on our new home page. If you attended his talk at the Google I/O conference this May, you might notice that the Analytics data model diagram has reappeared, but this time as a gateway into the key parts of our documentation on Google Code. We surfaced the most important links to provide deep access to the key parts of each section of the site.

New Landing Pages
Since we now have 3+ major sections on our site, it was time to provide landing pages for all the news and updates relevant to Tracking Code configuration, Management API, and Export API. Here you will always be able to see the latest release news and best practice guides for each API without having to dig down into the site.

We’ve also redesigned our navigation bar to be more visually appealing and consistent across all three APIs.

New Groups Pages
We have three major developer groups to help you out with your Analytics coding--Async tracking, Management API, and Export API. Not only that, but our general Help Forum is great for issues with general tracking topics. Since we have so many different groups, we created a new groups landing page to help you figure out which group will help you best.

Our Management API and Export API groups use the new Google Discussion Forum, which is embedded right in the page--a pretty nifty feature.

We hope that you find the new design makes it clearer and easier for you to find what you need for Analytics development. We’d love to hear your feedback, so please post any comments on one of our developer groups pages and let us know.

Patricia Boswell on behalf of the Analytics API team.

Launched: New Google Analytics Management API!

Many developers have asked for a faster, more powerful way to access Google Analytics account configuration data through the Data Export API. We’ve listened and today we’re releasing a preview of the new Google Analytics Management API.

The Management API provides read-only access to Google Analytics configuration data. It consists of 5 new Google Data Feeds that map directly to the Google Analytics data model.


Previously, the API returned all the configuration data at once, which in many cases was inefficient if you only needed a subset of data. Now with separate feeds, developers can request only the data they need. For example, it’s now easy to get the Profile IDs for a single account or the Goal configuration data for only a single Profile.

To help you learn more we created a new Management API section in our developer documentation. We also created new reference examples in Java and have a live working demo in JavaScript. Check it out, no coding needed!

The Management API is being launched in Labs as an early preview. The API will change, grow, and get better over time. We recommend developers who aren’t committed to making updates to their applications only experiment with the new API and continue to use the Account Feed as their primary source for configuration data. We will strive to give you at least one month advanced notice of changes to this API.

The Management API represents a significant new piece of the Google Analytics developer platform. We encourage you to come try it out and give us feedback in our new Management API Google Group.

Thanks!
Jeetendra M. Soneja, on behalf of the Google Analytics API team

P.S. - Please make sure to sign-up for our notify list to stay up-to-date on all the latest Google Analytics Developer updates.